XENTINEL WATCHTOWER · THE FLAGSHIP PLATFORM
One map, every layer, one operational picture
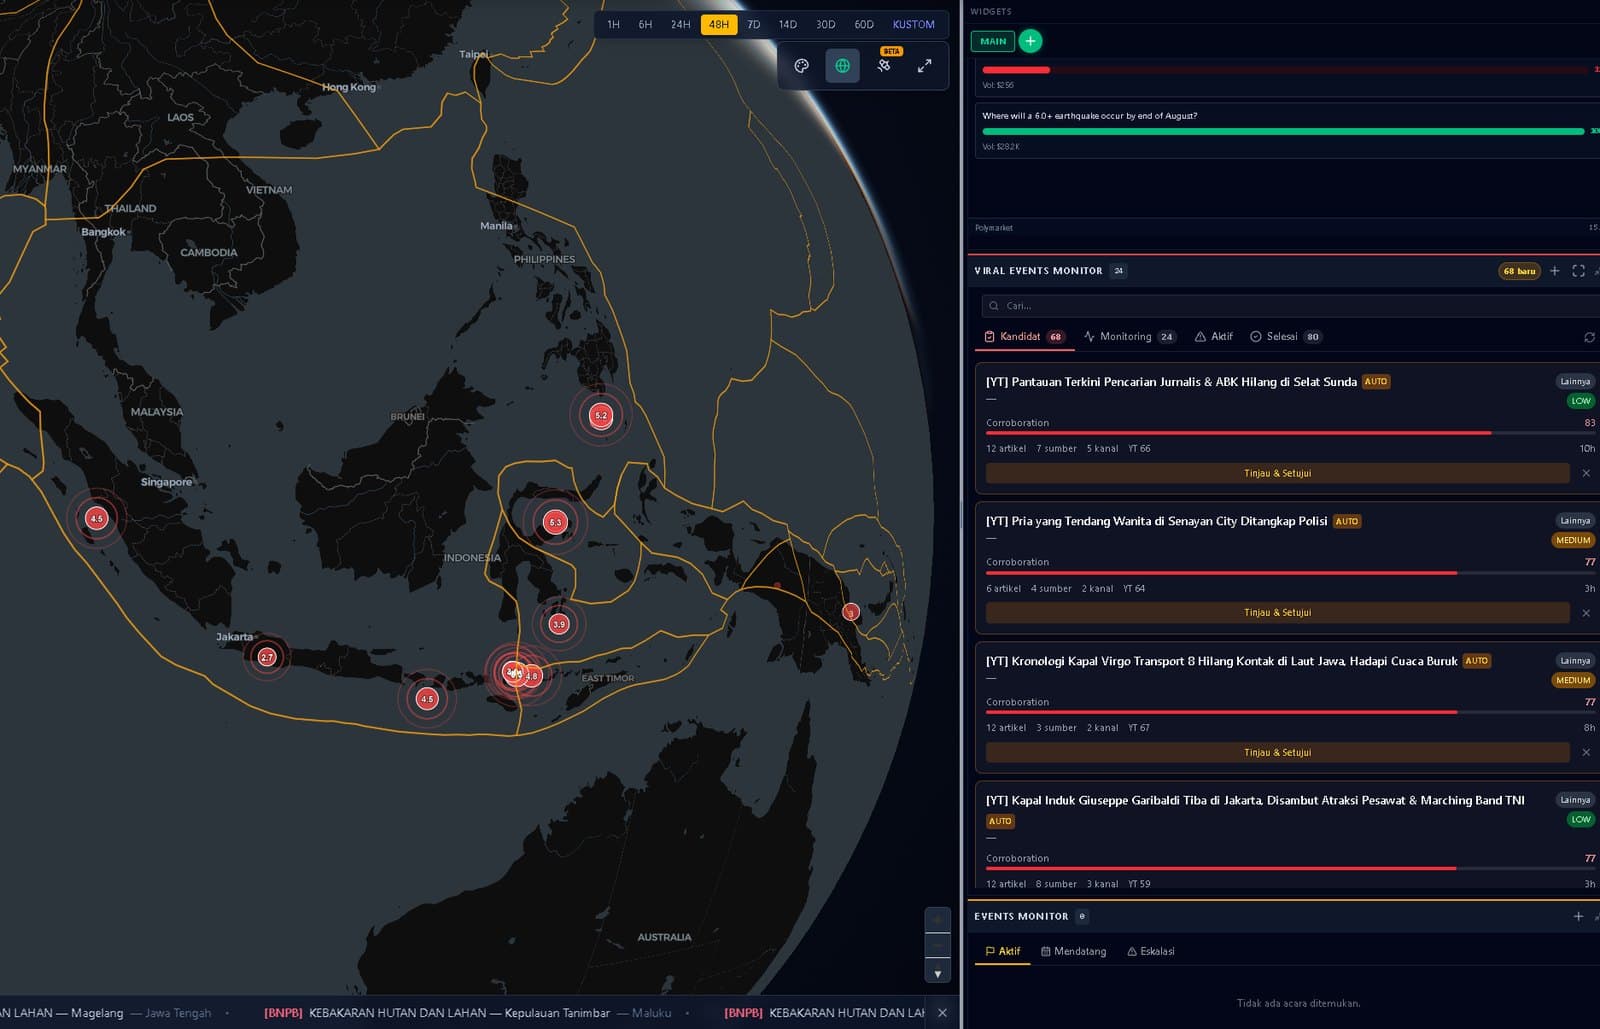
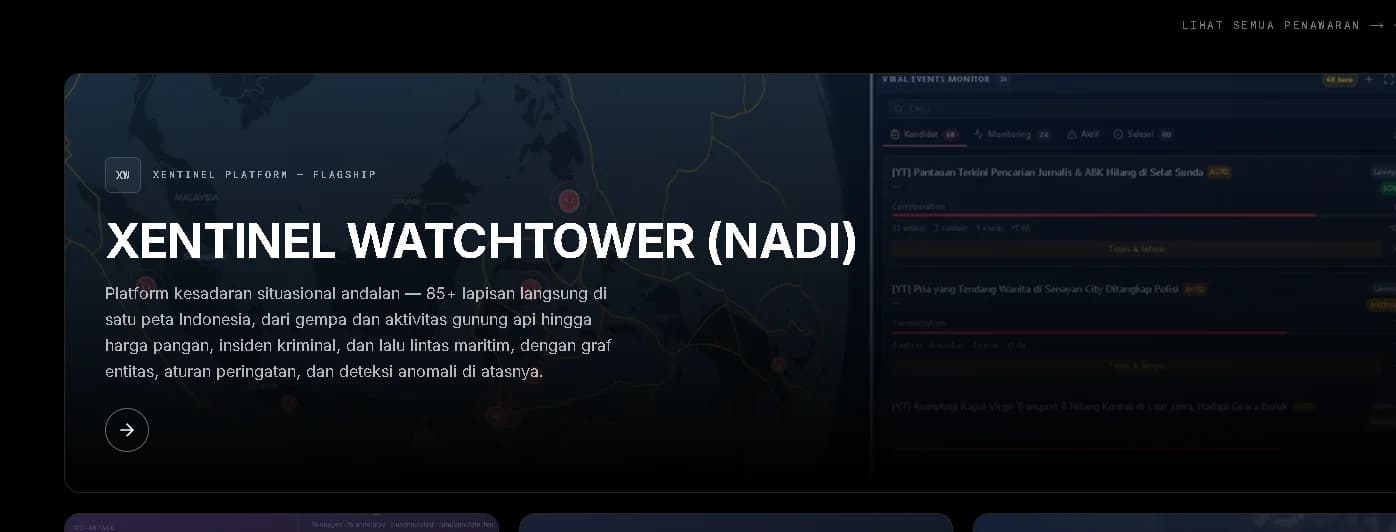
The flagship situational-awareness platform — 85+ live layers on one map of Indonesia, from earthquakes and volcanic activity to food prices, crime incidents and maritime traffic, with an entity graph, alert rules and anomaly detection on top. Previously known as NADI.
Xentinel Watchtower — previously known as NADI — is a real-time situational-awareness platform for Indonesia: more than 85 data layers drawn from over 20 public data sources, unified on a single interactive map with a cross-source entity graph, alert rules, automated situation reports, and a chat assistant that runs on locally hosted models.
What Xentinel Watchtower does
Xentinel Watchtower gathers the feeds that describe the country — hazards, weather, maritime traffic, economic indicators, incidents and media — into one place where they can be read together, and adds the machinery that turns reading into routine work: links between entities, rules that watch for change, reports on a schedule, and an assistant you can question.
01
One operational picture
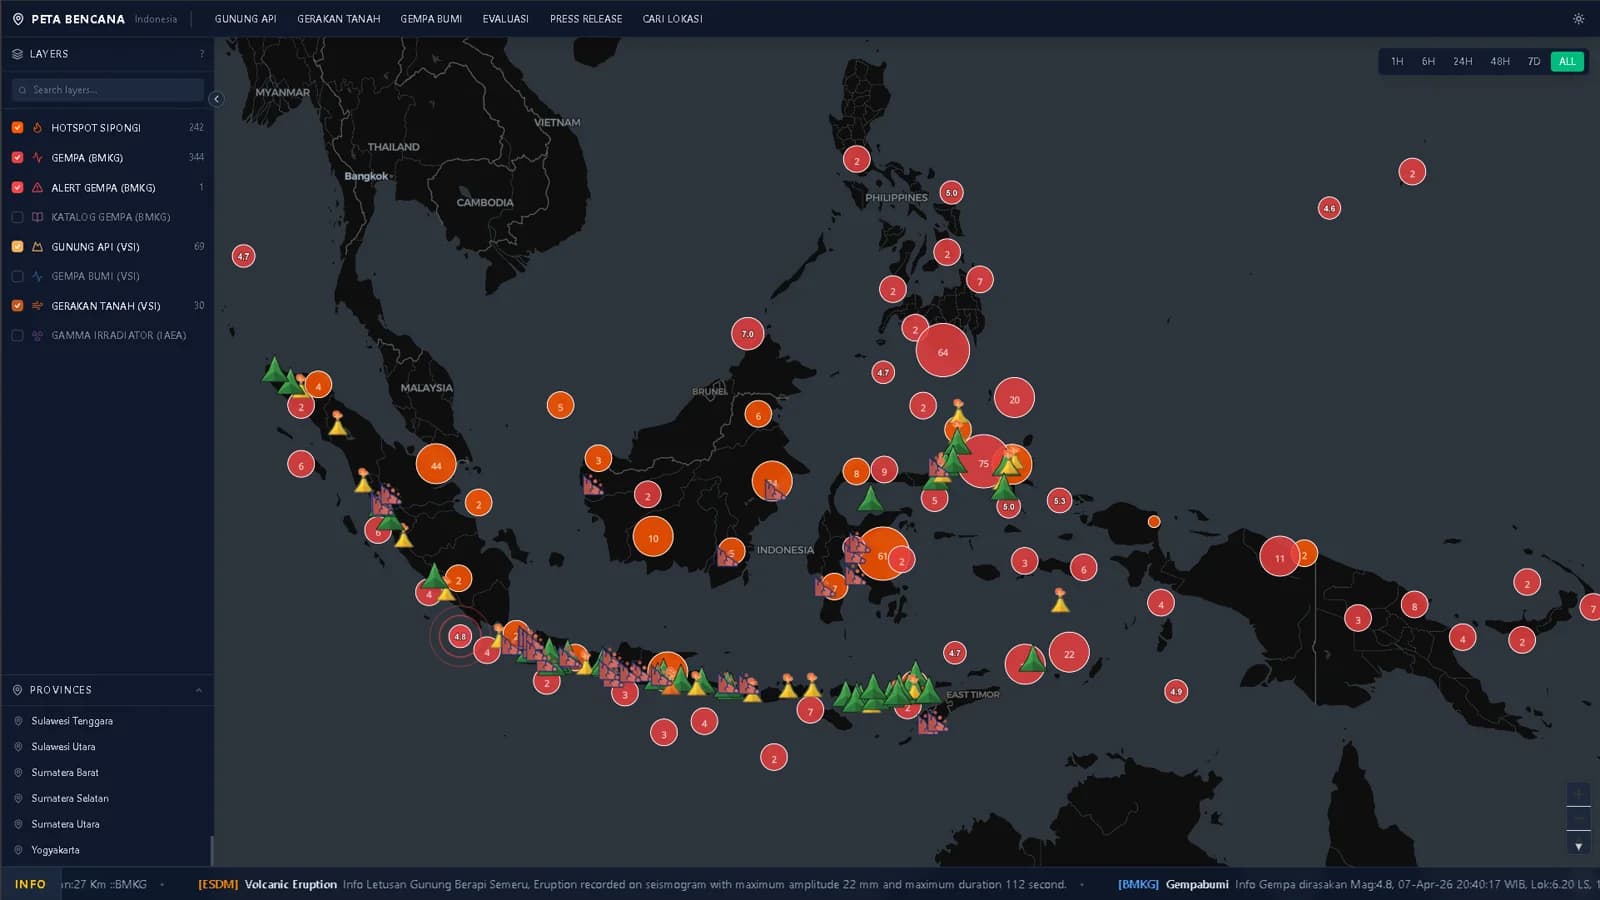
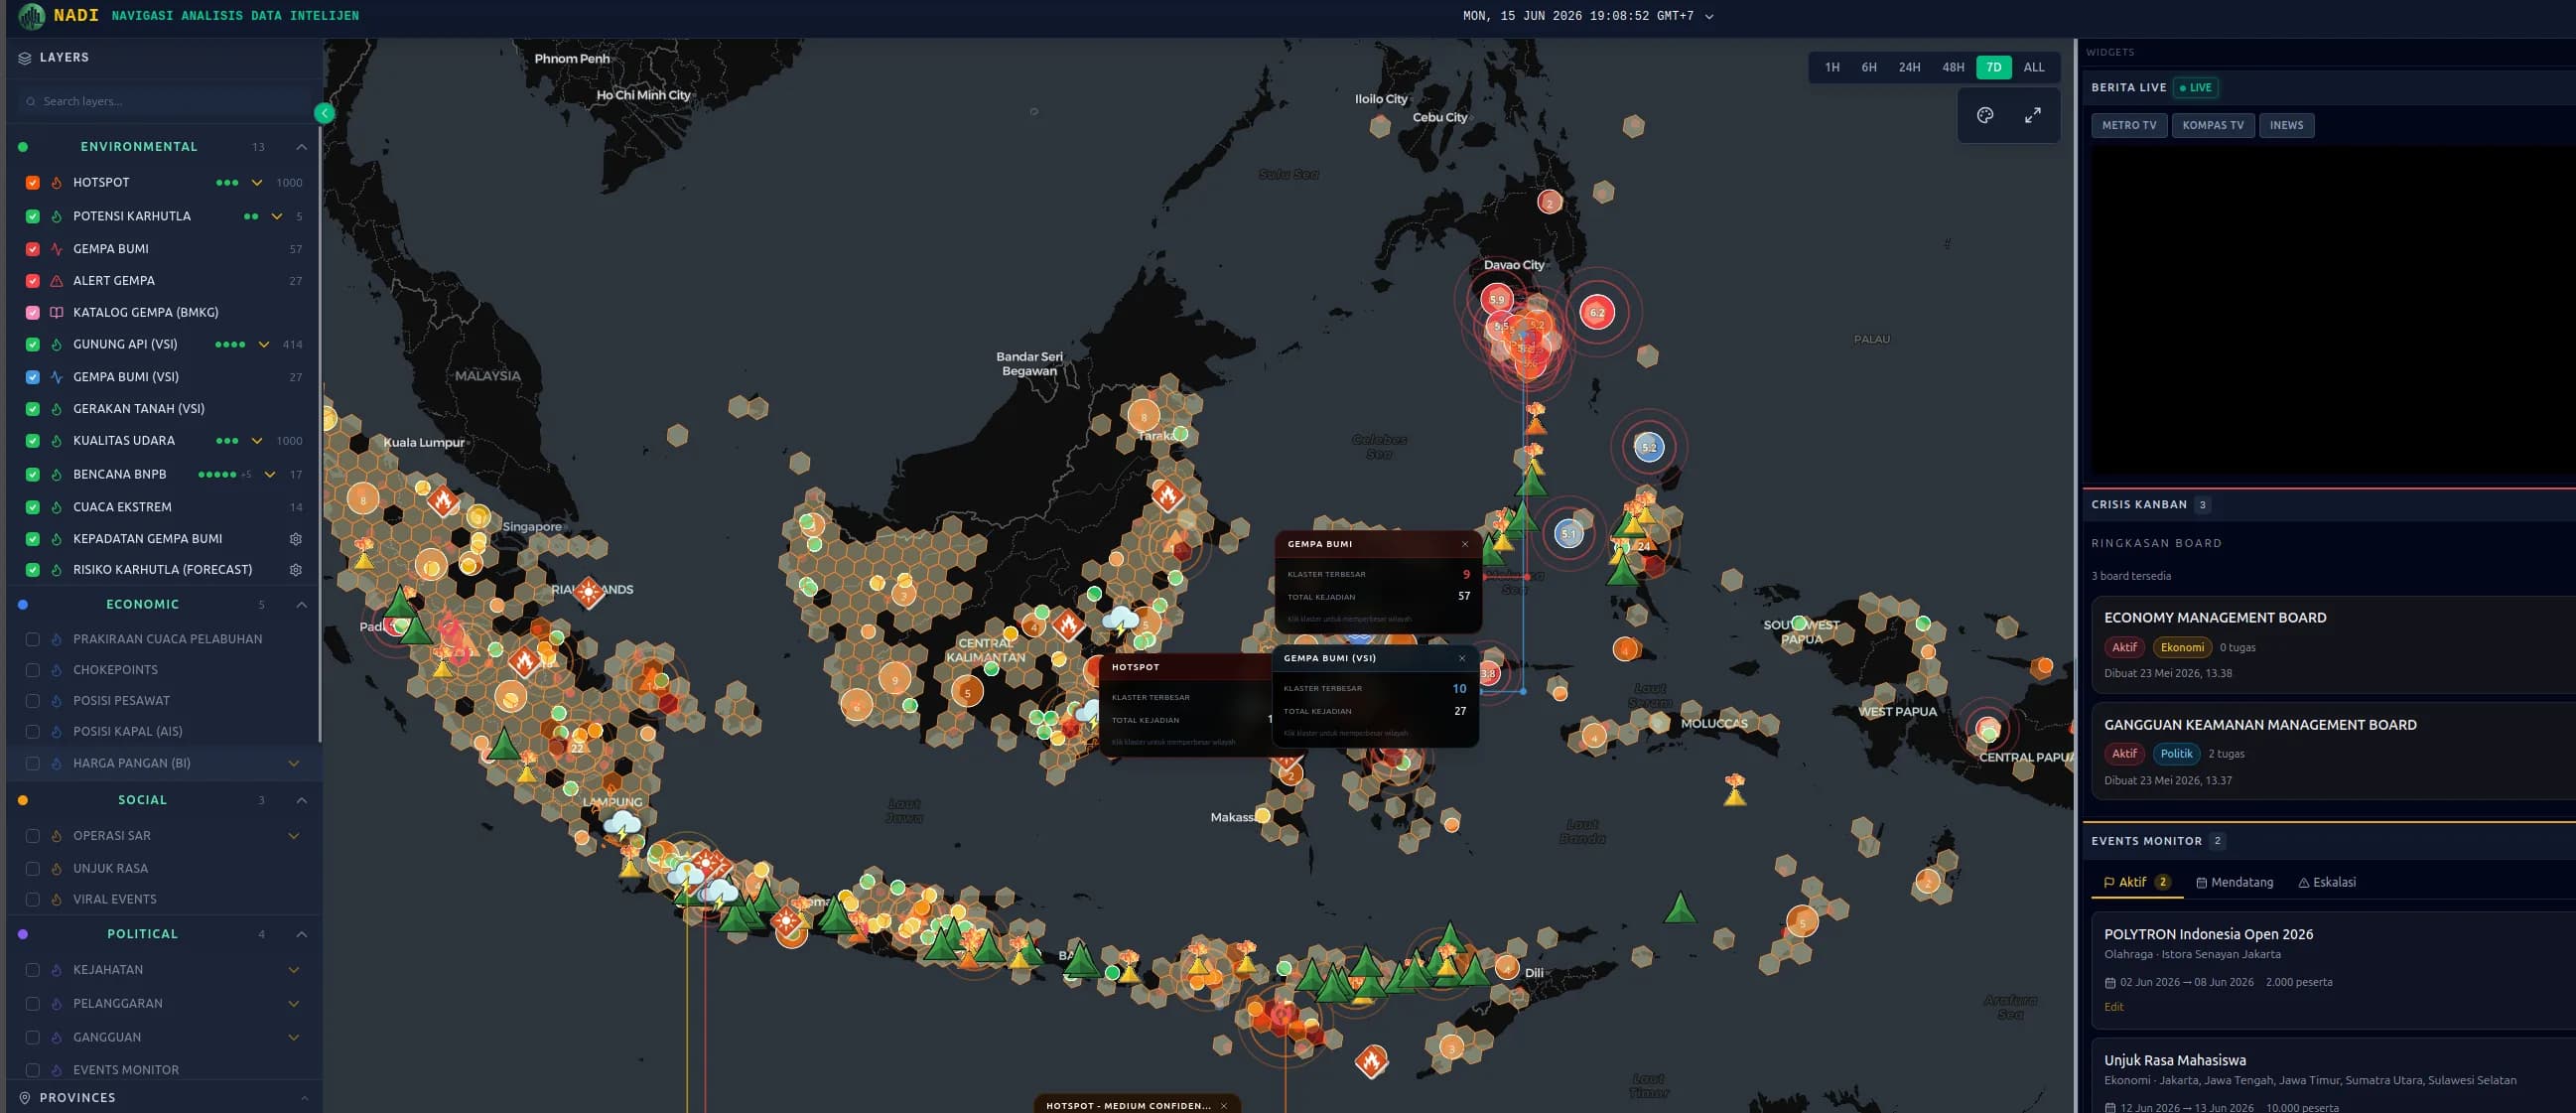
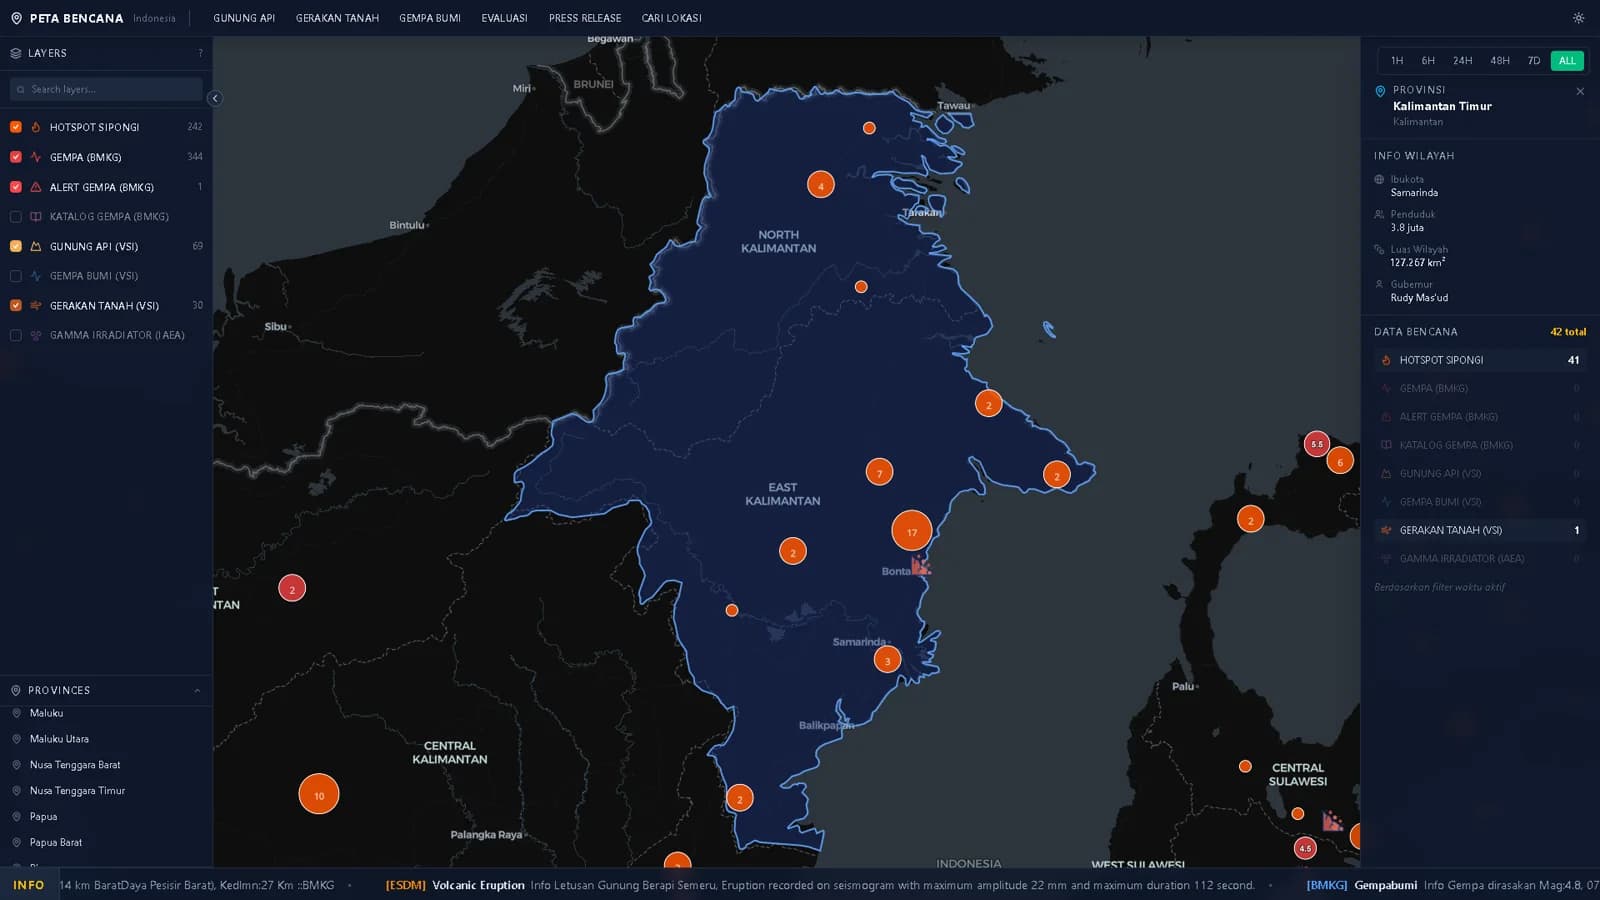
85+ toggleable layers fed by over 20 public data sources through 38 ingestion pipelines, sharing one map, one timeline and one time filter — from earthquakes and volcano status to food prices, vessel traffic and weather warnings.
02
Connected, not just plotted
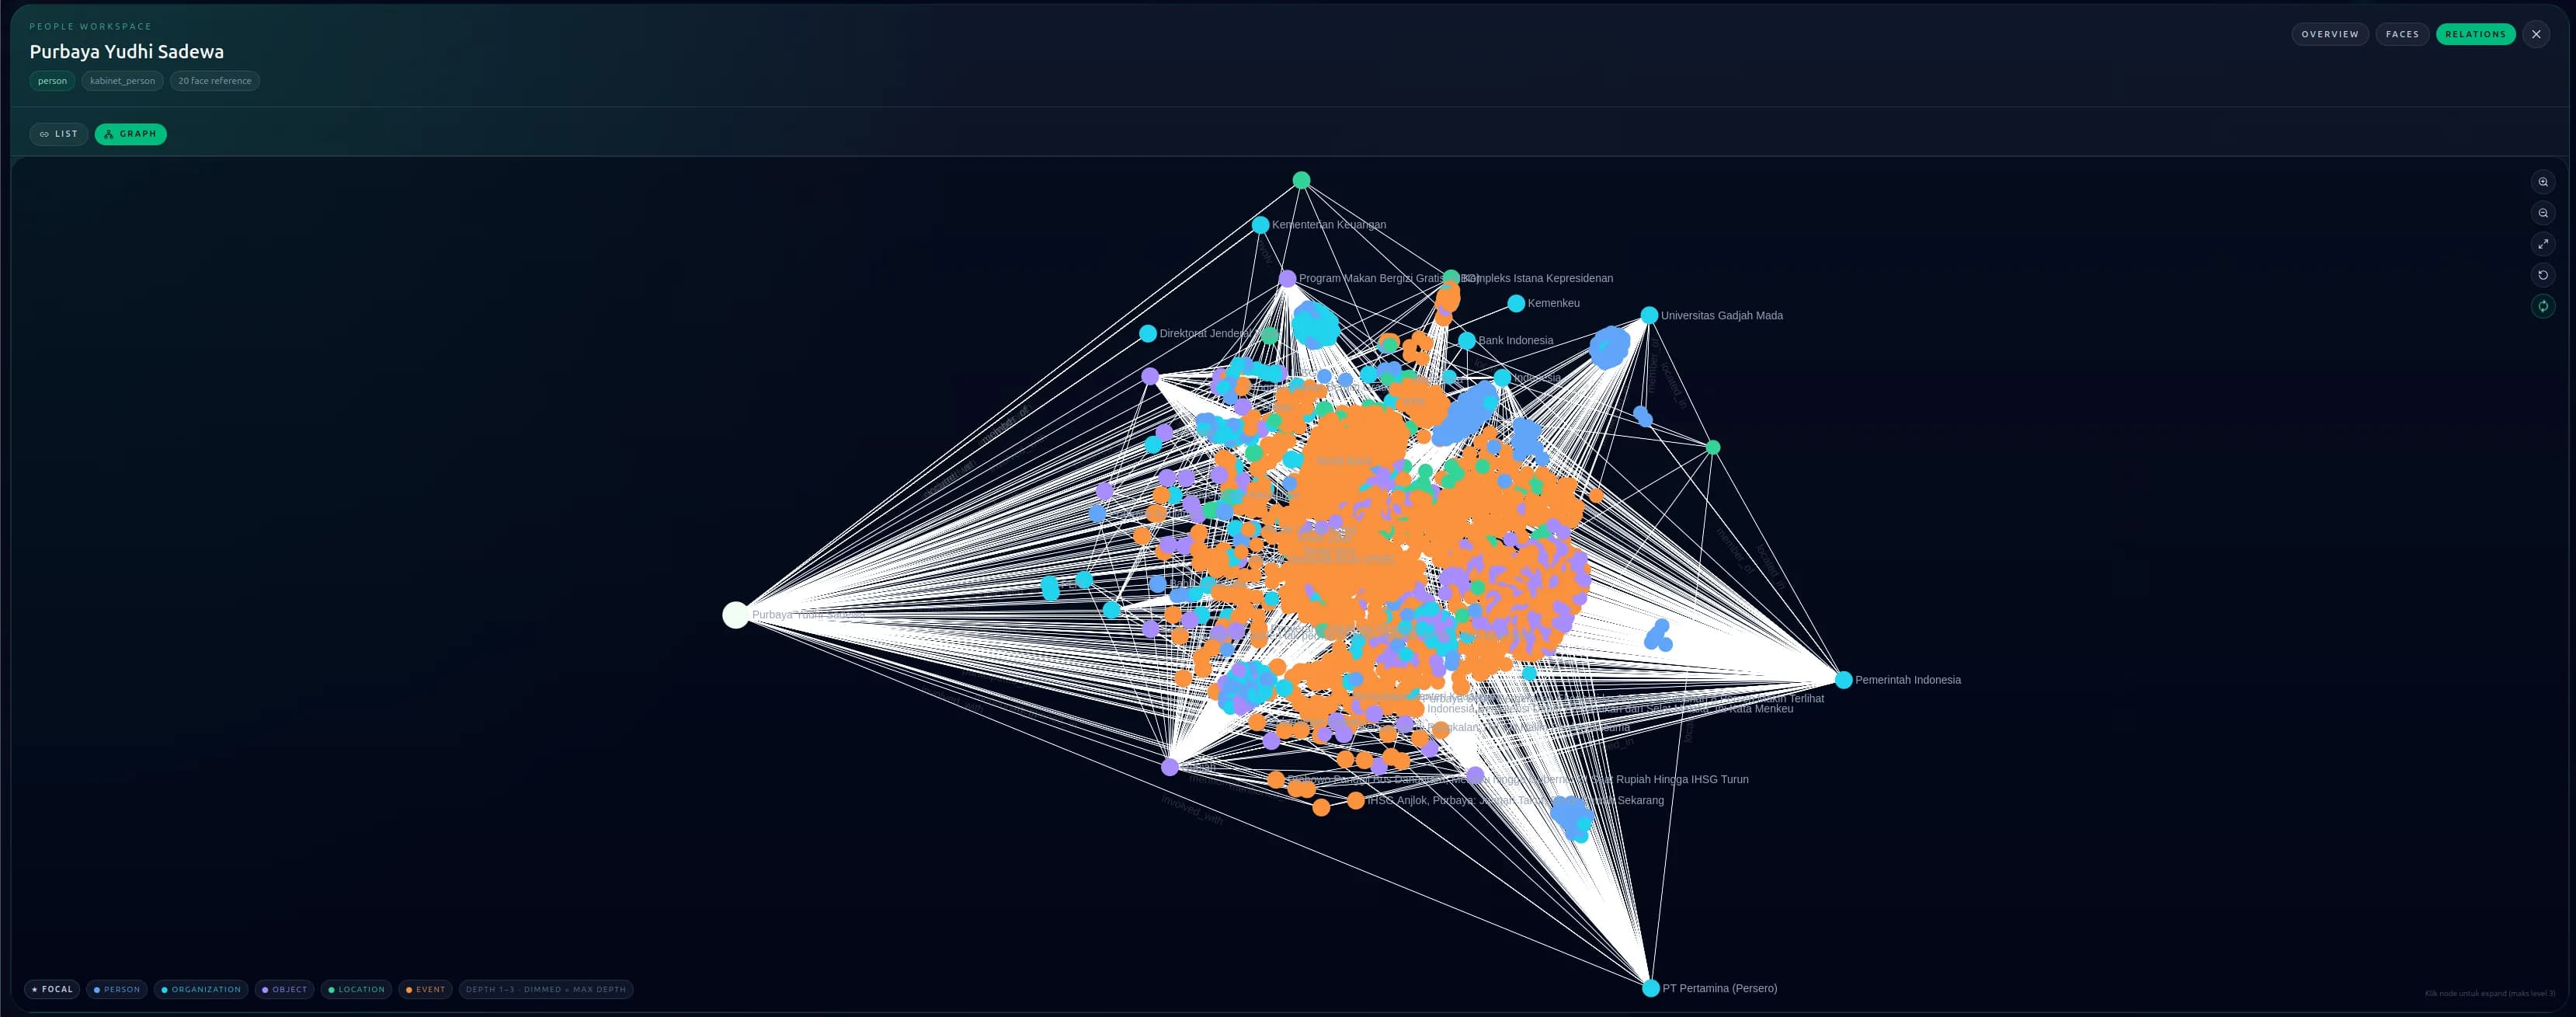
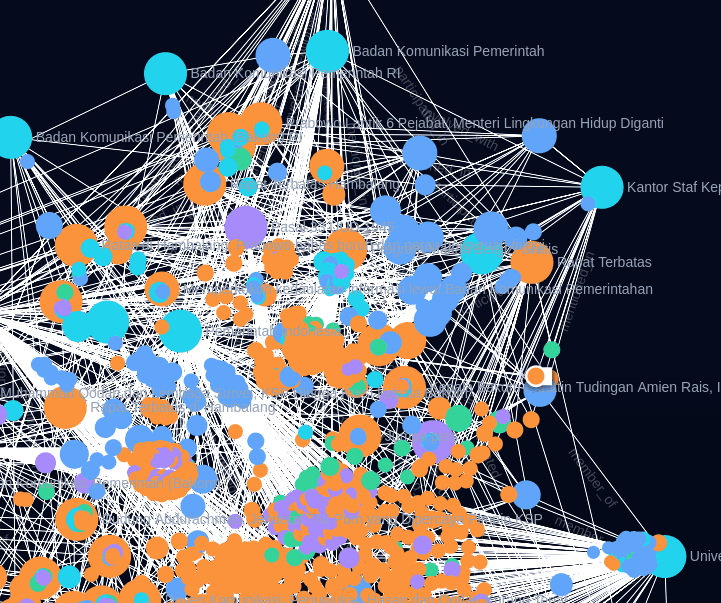
The POOLE entity graph links an event to the organisations that respond, the places inside its radius, the institutions and officials related to it, and the coverage written about it — with cross-source deduplication so one entity stays one record.
03
Analysis and action in one place
A chat assistant answers over platform data and over documents you upload, on locally hosted models. Crisis boards, field reports and user-defined locations keep the response work beside the analysis that prompted it.
Core Capabilities
What the platform does, capability by capability.
01
Interactive geospatial map
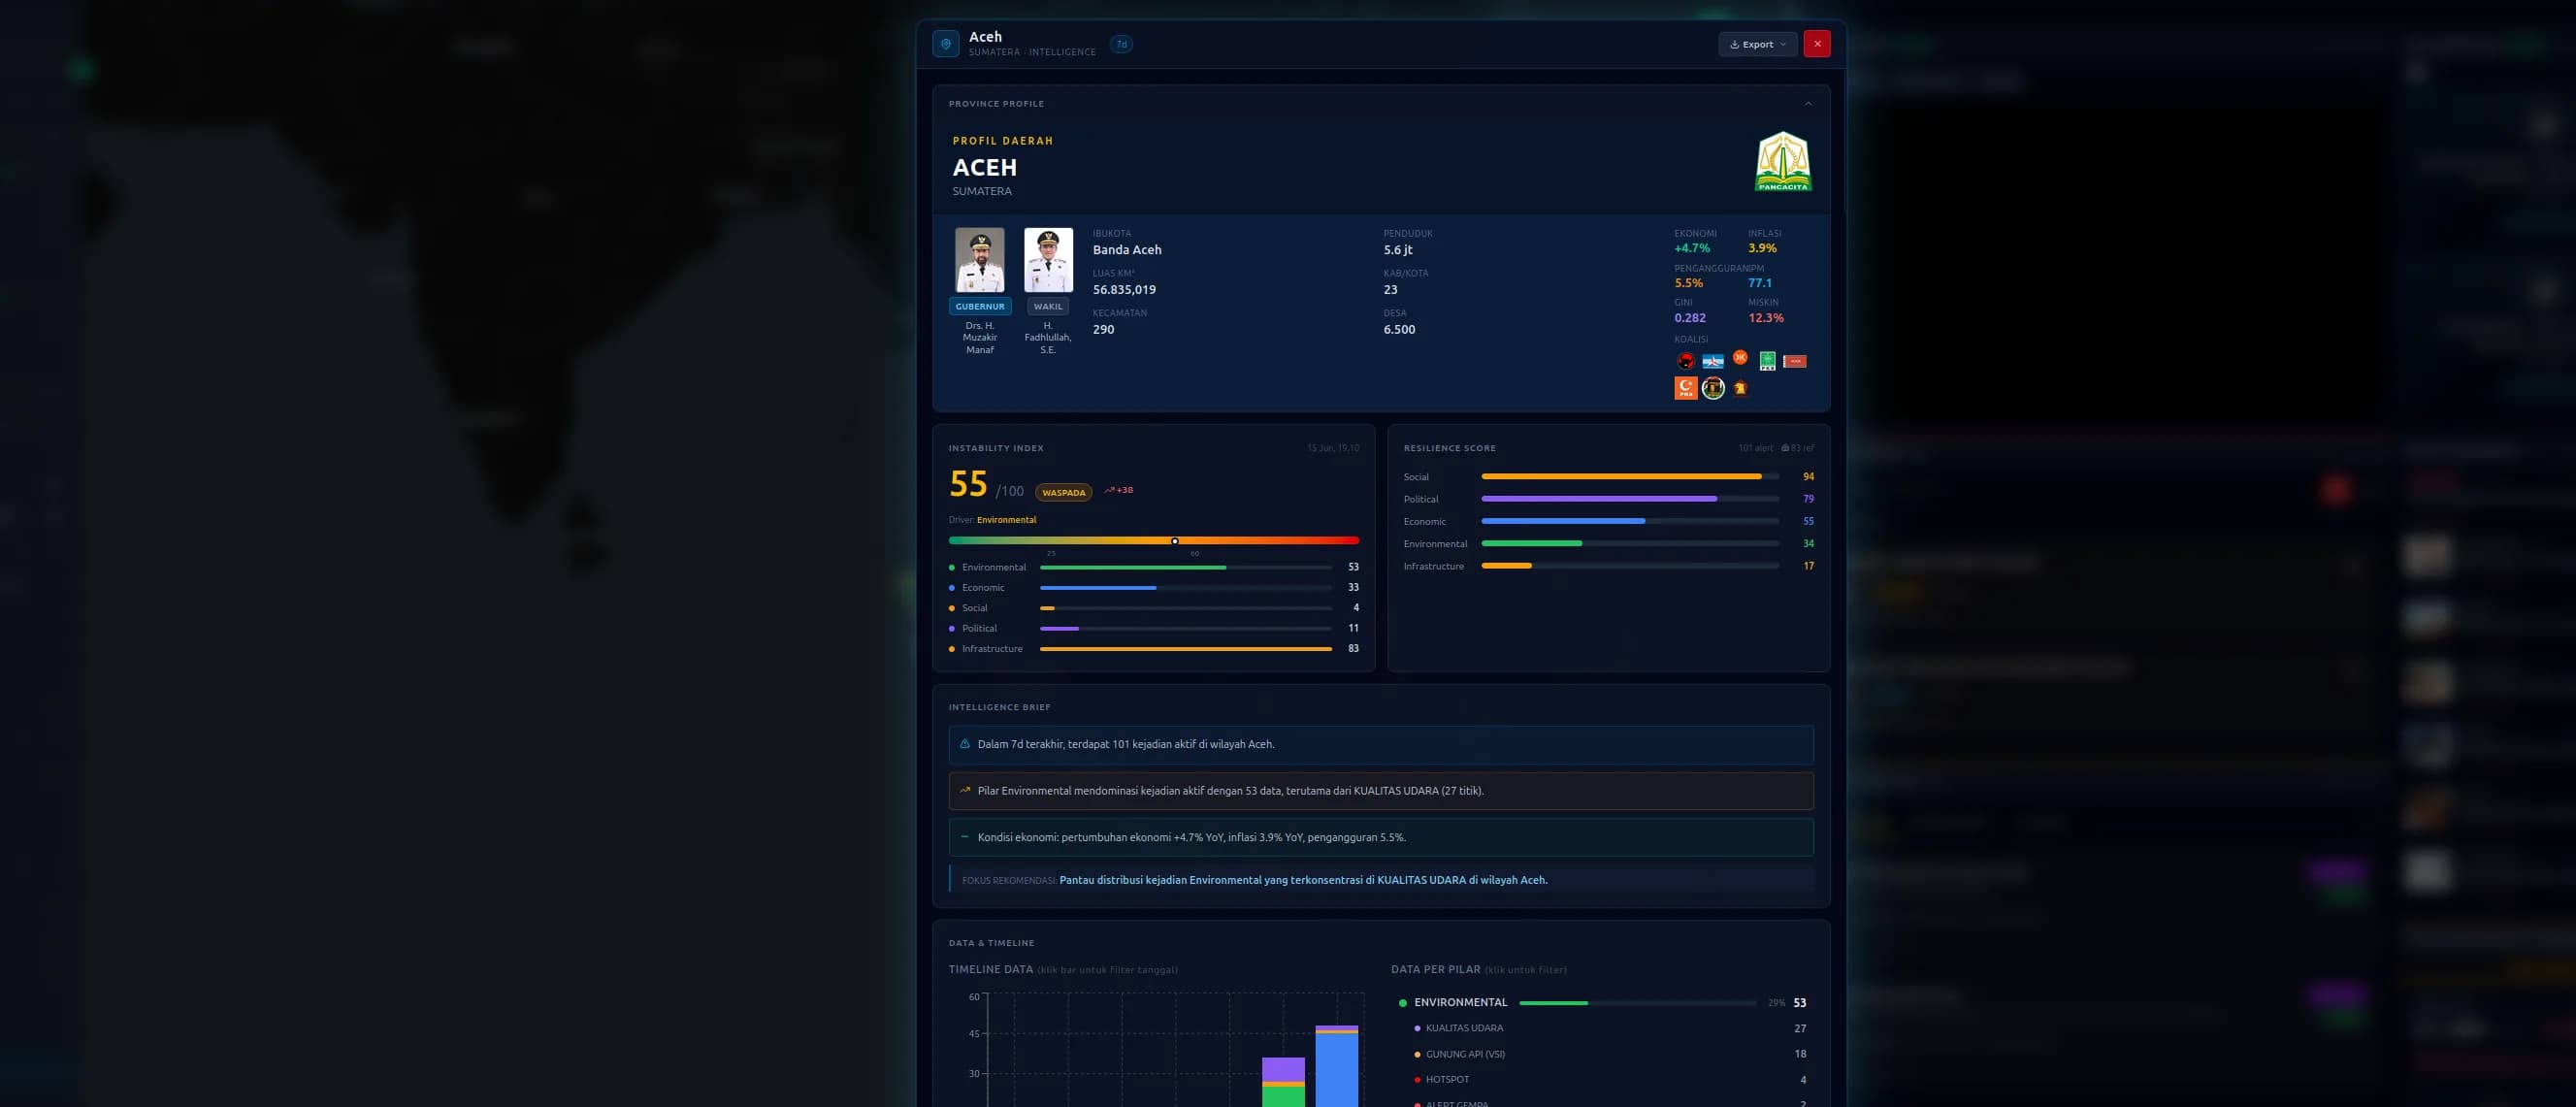
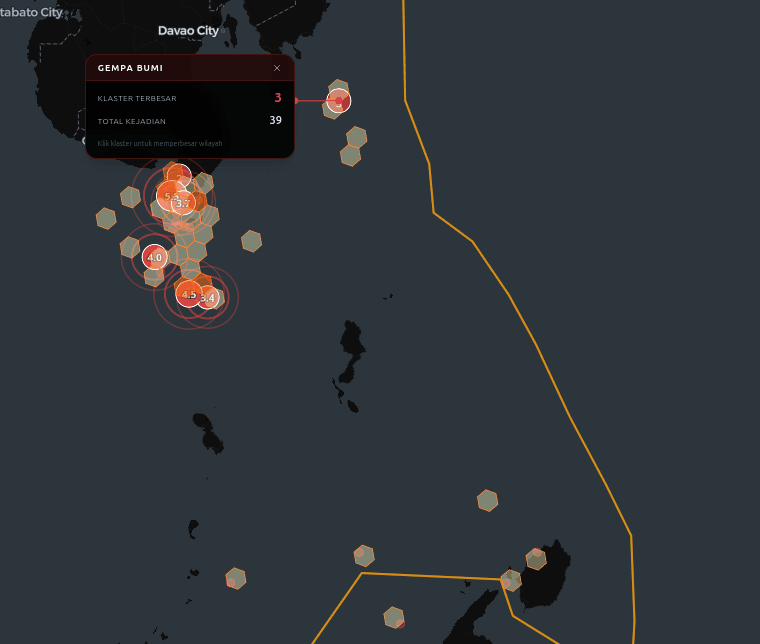
85+ toggleable layers with searchable grouping, hexbin density views, severity-aware clustering, province drill-down, and a 24-hour timeline with playback and speed control.
02
Environmental hazard monitoring
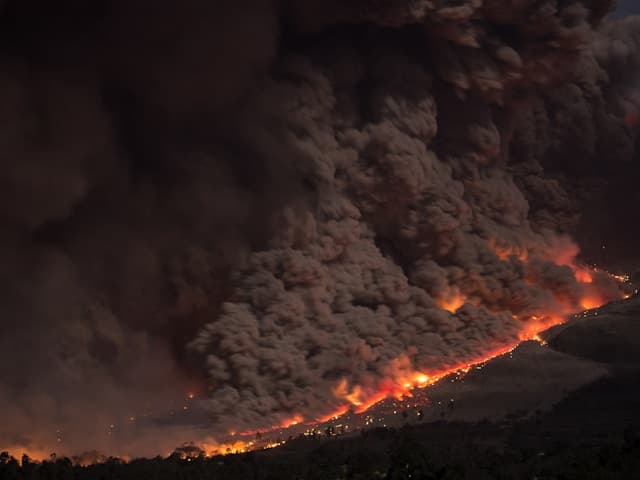
Earthquakes from two independent seismic feeds, all 127 Indonesian volcanoes with alert status, ground movement, wildfire hotspots with forest-boundary context, air quality, and active weather warnings with their affected areas.
03
Maritime and supply chain awareness
Live vessel positions, marine forecasts for 673 ports, boundaries for 375 maritime zones, and risk scores for 13 strategic passages computed against each passage's own 30-day baseline, with daily or weekly PDF briefs.
04
Economic and public indicators
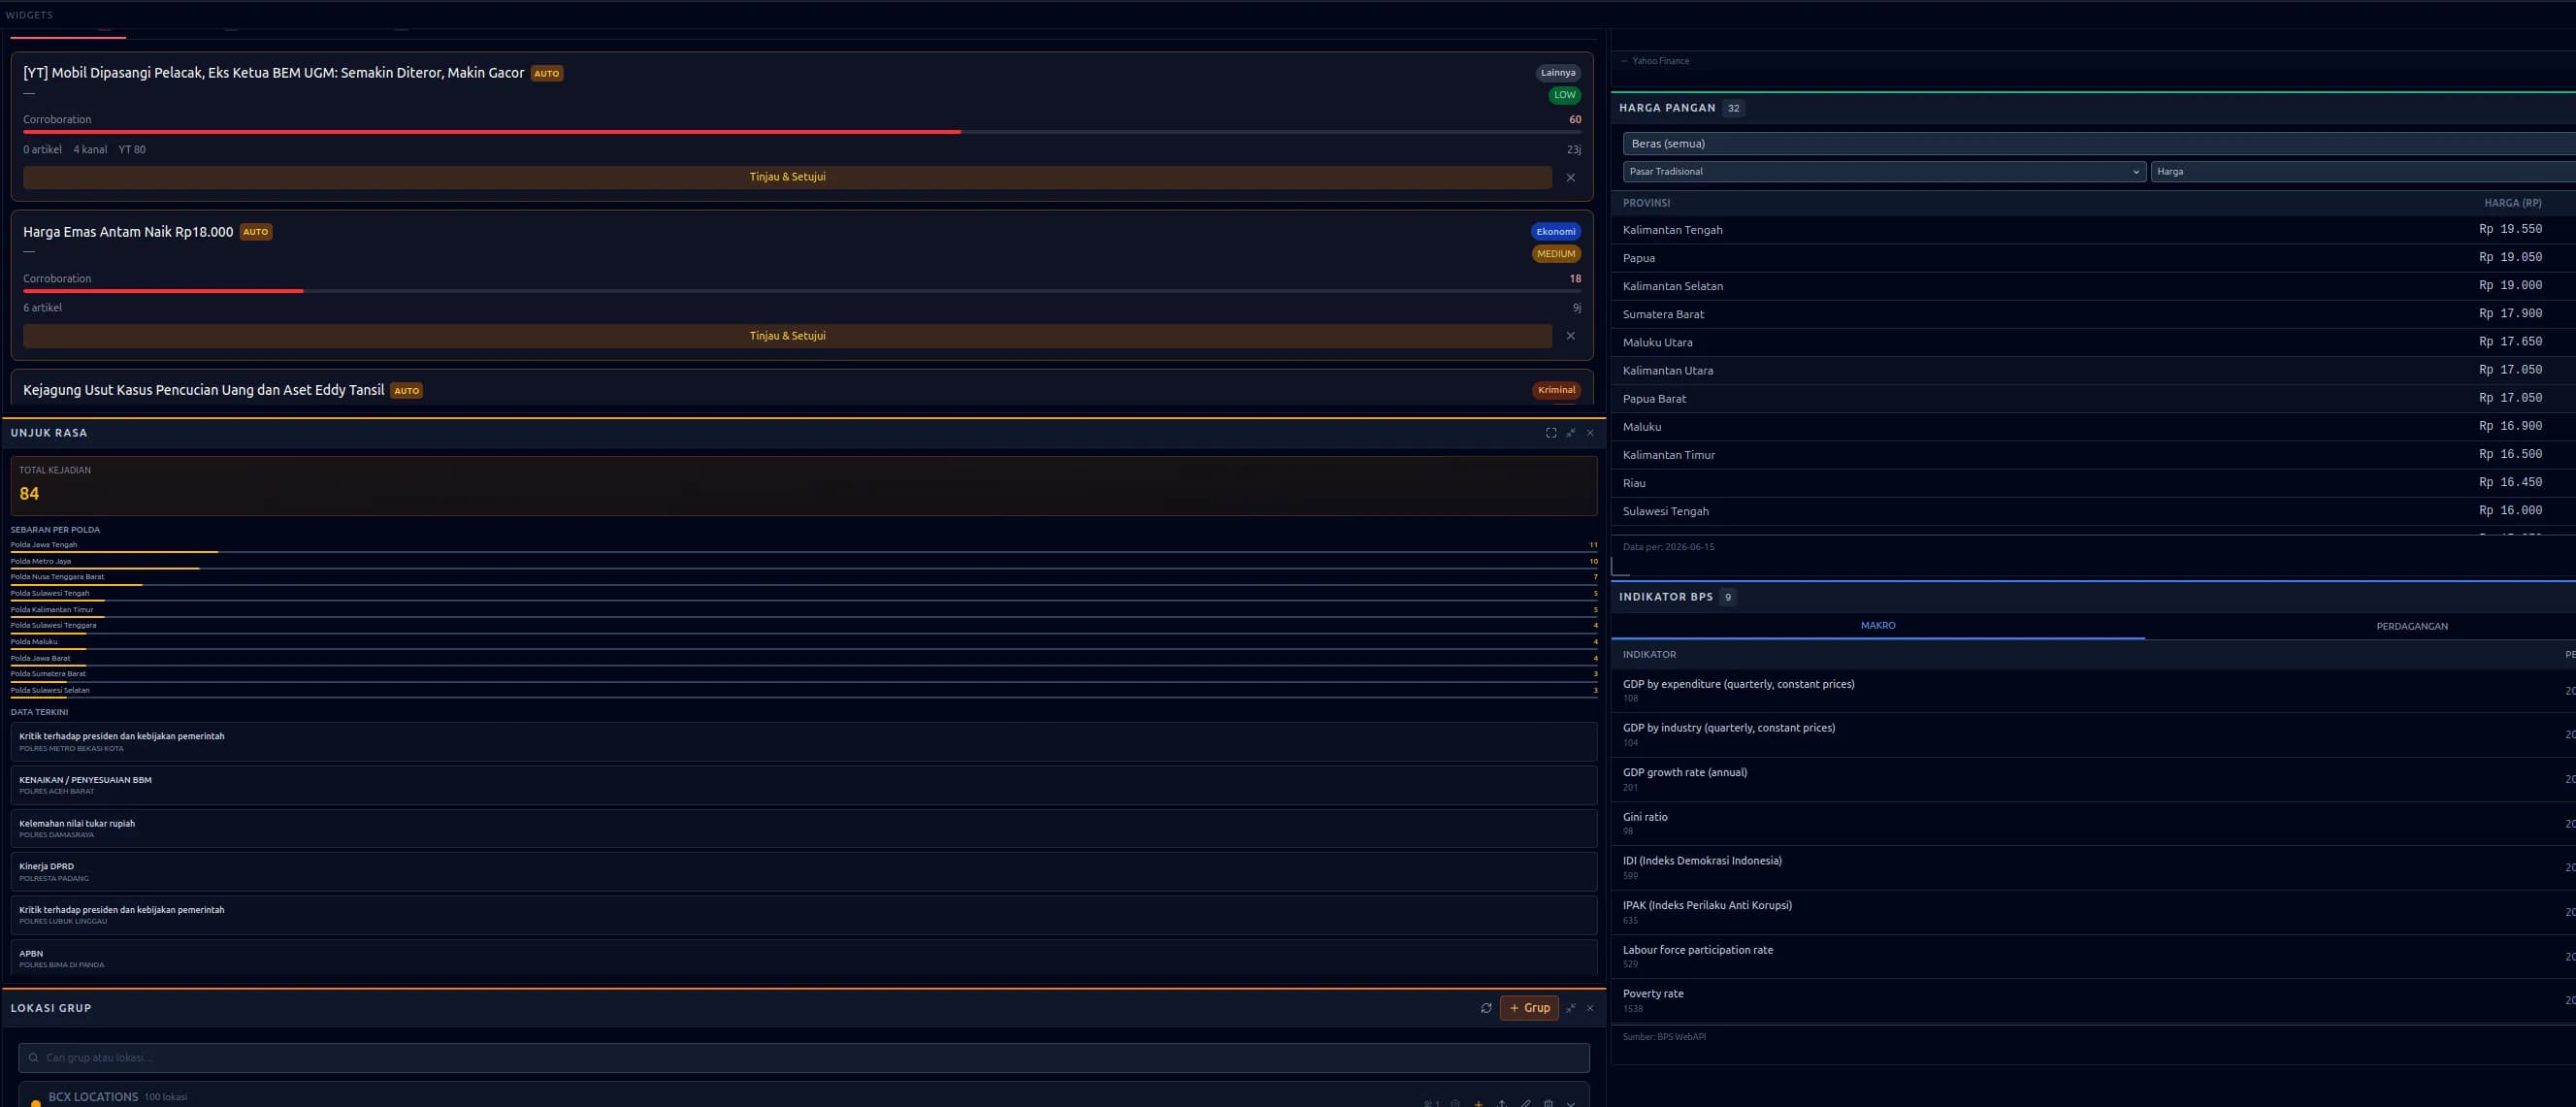
Daily food prices across 34 provinces with inflation sub-layers, provincial and macro statistics, foreign-trade flows, financial-market indicators, and development series with their history.
05
Political and security monitoring
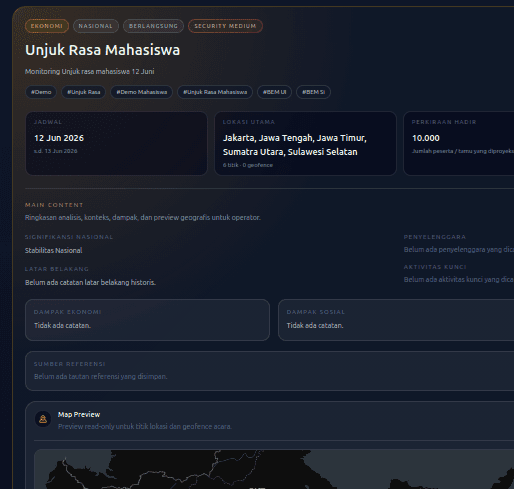
Crime incidents with hexbin risk mapping, demonstration monitoring with risk scoring, and the office and institution hierarchies beneath them — read on the same map, against the same timeline, as every other layer.
06
POOLE entity graph
A Person–Organisation–Object–Location–Event graph with canonical identifiers, fuzzy location resolution, proximity queries and cross-source deduplication, so a place or an institution is recognised across every feed.
07
Rules, reports and assistant
A metric builder with alert rules carrying thresholds, change conditions and spatial constraints; baseline-aware anomaly detection; automated situation reports in Bahasa Indonesia as PDF; and a bounded chat assistant over platform and private data.
08
Crisis action workflow
Create crisis kanban boards directly from a disaster popup, run big-event war rooms with VIP and CCTV assignments, and track the response through to closure.
09
Custom data and field input
Import ArcGIS FeatureServer or GeoJSON layers, define your own points and perimeters, and fold field-survey operator reports into the same timeline.
Inside the platform
Screens from the running system — the map, the entity graph, the monitoring widgets and the risk views.
Where It Fits
Four operational problems this platform was built for.
Disaster and hazard management
Multi-hazard situational awareness on one screen — earthquakes, volcanoes, landslides, wildfires, weather warnings and field reports — with automated situation reports in Bahasa Indonesia.
Maritime and logistics operations
Live vessel traffic, passage risk read against baseline, and port forecasts, sitting beside the trade and price layers that show what a disruption would touch.
Security and public safety
Crime patterns, demonstrations, social signals and wider events connected through the entity graph — relationships that stay invisible in single-domain dashboards.
Economic and policy analysis
Food prices, trade flows, markets and development indicators, read alongside the environmental and security events that move them.
The Xentinel Family
Xentinel is the brand; these are the products inside it.
Flagship platform
Xentinel Watchtower
The situational-awareness platform described on this page — the map, the layers, the entity graph, the alerting engine — and the product the Xentinel brand is built around. NADI is the name it was built under; Xentinel Watchtower is the name it carries now.
The vision line
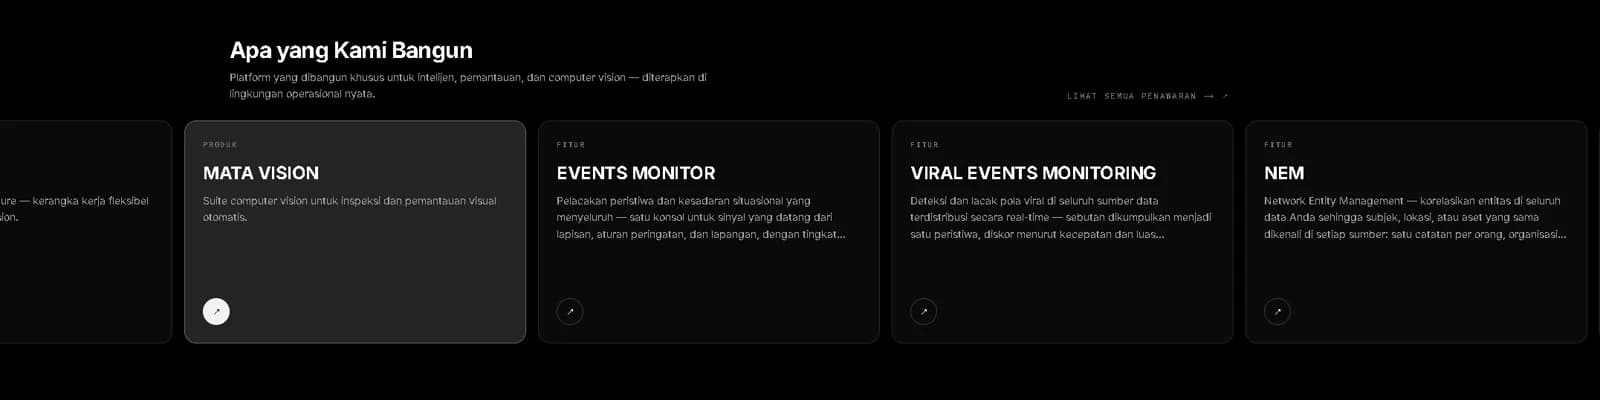
Xentinel Vision
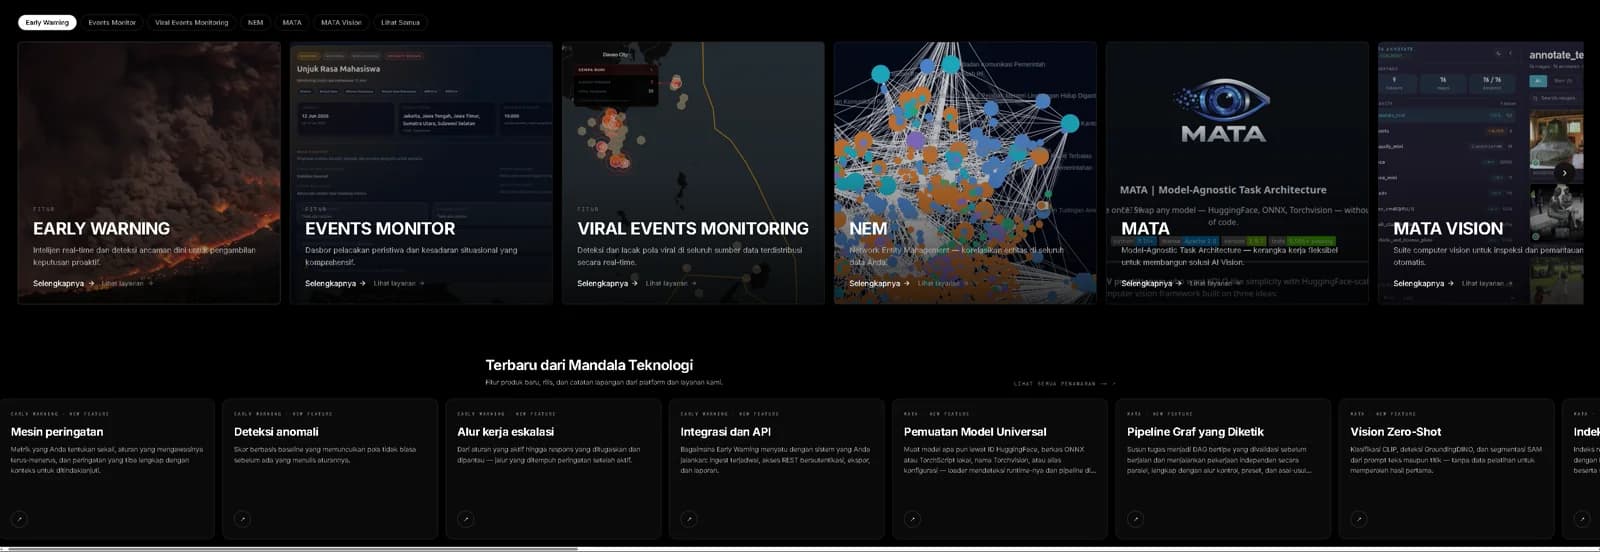
Inspection, monitoring and edge deployment for camera fleets, built on the MATA framework and running on the customer's own hardware, inside their network.
Learn moreRuns on customer infrastructure
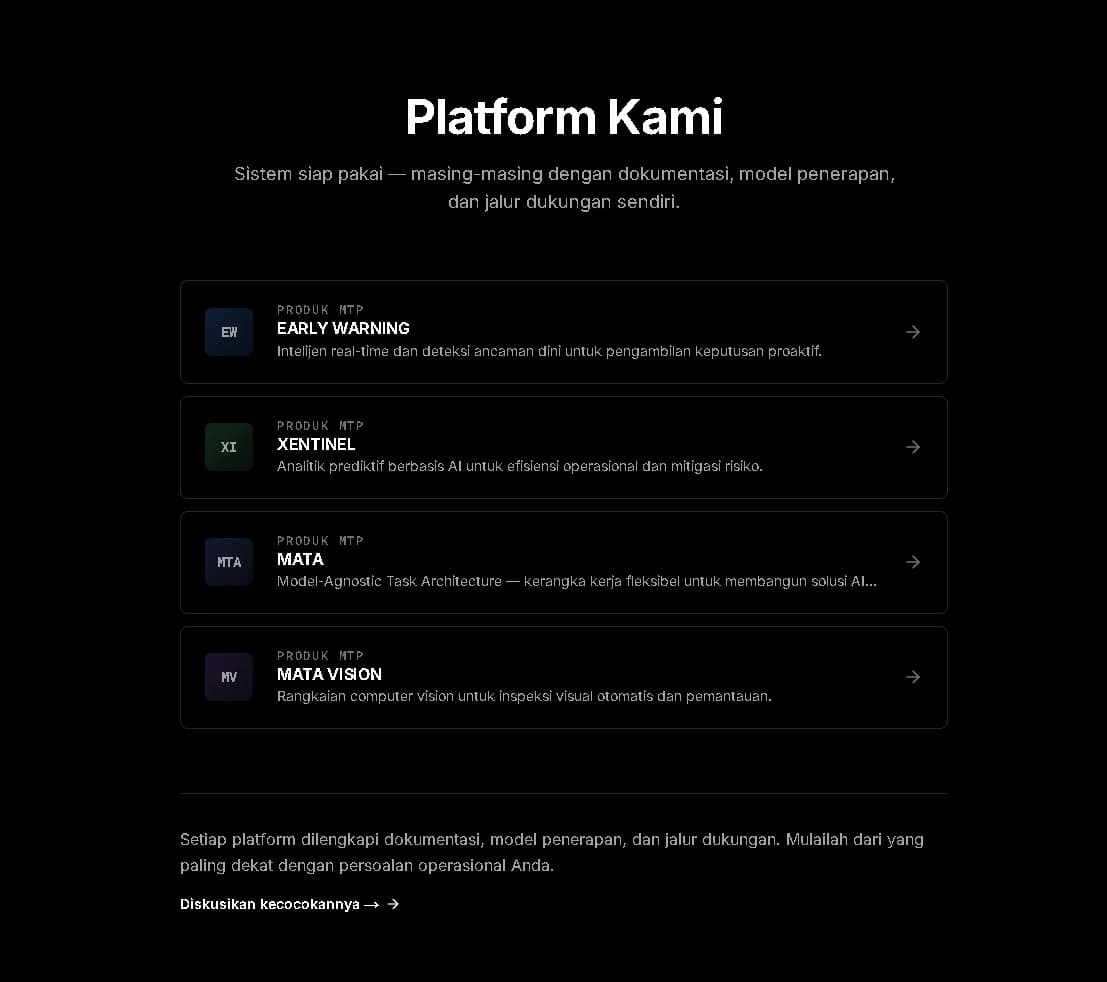
Early Warning
The alerting product: the alert rules and anomaly detection from this platform, packaged to run inside the operator's own environment.
Learn moreLatest from Xentinel Watchtower
New features, releases and writing from this platform.
NEW FEATURE
Multi-source data layers
More than 85 toggleable layers over one map, fed by over 20 public data sources through 38 ingestion pipelines, with a layer panel and a source registry that keep every feed current.
NEW FEATURE
Hazard monitoring layers
Two seismic feeds, all 127 Indonesian volcanoes with alert status, landslides, fire hotspots with forest context, air quality and weather warnings — with the history that makes a reading interpretable.
NEW FEATURE
Maritime and supply chain awareness
Live vessel positions, forecasts for 673 ports, and risk scores for 13 strategic passages computed against each passage's own baseline.
NEW FEATURE
An assistant over your own data
A chat assistant that answers over platform data and over documents you upload, on locally hosted models, with a bounded toolset and an audit record of every attempt.
NEW FEATURE
Alert rules and anomaly detection
Metrics on a semantic layer, alert rules carrying thresholds, change conditions and a radius, and baseline-aware anomaly detection beside them.
NEW FEATURE
Situation report automation
The daily or weekly situation report, assembled from live data and written in formal Bahasa Indonesia by a locally hosted model, exported as a PDF.
NEW FEATURE
POOLE entity graph
A Person–Organisation–Object–Location–Event graph that recognises the same person, place or institution across every feed it ingests.
NEWS
NADI is introduced as Xentinel Watchtower
The situational-awareness platform we have been building as NADI now carries the name Xentinel Watchtower, the flagship product of the Xentinel family.
See it on your region
We run technical briefings and scoped demonstrations. Tell us which operational picture you need to see and we will show it with your area and your data sources.